Current Portfolio & Historical Benchmarks (2010 – 2026)
Strategic Intent: Compare your parents' actual 15.6-year results ($787,900) against standard benchmarks under two fair lenses: (1) Real-World Trajectory with $30k/yr Living Expense Withdrawals, and (2) Pure Compounding Engine with Zero Withdrawals.
$787,900 across 5 Accounts
70.7% Qualified IRAs ($557k) must remain under individual names (no joint IRAs exist); 29.3% Non-Qualified annuities ($231k).
~$11,900 / year (~1.52% Blended)
Advisory fees (~1.0%) + Prudential M&E insurance fees (~1.3%) + fund fees consume nearly half of annual growth.
60% Stocks & 40% Bonds
The classic retirement baseline: 60% equities for inflation-beating growth, 40% bonds for cash cushion and living expense stability.
Chart 1: Real-World Performance (With $30k/yr Withdrawals)
Cash Flow RealitySimulates starting with $430k in 2010 and pulling out ~$30k/year for living expenses (~$480k total pulled out).
Actual Ending
$788k
60/40 (60% Stk/40% Bnd)
$1.18M
100% S&P 500
$1.94M
*Even after paying $480k in living expenses, a standard 60/40 index portfolio would have left ~$390k MORE ending wealth.
Chart 2: Pure Compounding Engine ($0 Withdrawals)
Pure HorsepowerShows what $430,700 of untouched principal would have grown to over 15.6 years without any cash withdrawn.
Actual Engine (4.5%)
$858k
60/40 (7.8%)
$1.39M
100% S&P 500 (13.1%)
$2.96M
*Without any withdrawals, fee drag and underperforming annuities caused a -$530k gap vs 60/40 and -$2.1M vs S&P 500.
Audited Portfolio Inventory & Annual Fee Drag (Aug 2026)
Cleaned dataset resolving multi-year statement duplication errors (anonymized to nearest $100).
| Owner | Account & Number | Vehicle / Holdings | Balance ($) | Tax Wrapper | Est. Annual Drag | 1-Yr Return | 3-Yr Return | 5-Yr Return | RMDs? |
|---|---|---|---|---|---|---|---|---|---|
| AA | MWP IRA (...61) | American Funds G&I Wrap | $384,300 | Qualified IRA | ~1.40% ($5,380) | 13.98% | Unknown* | Unknown* | YES (if 73+) |
| AA | Allianz Master Dex X (...34) | Fixed Index Annuity | $79,800 | Qualified IRA | Cap Drag | 0.00% | 1.49% | 2.80% | YES (if 73+) |
| JJ | Prudential APEX II HD6 (...78) | Variable Annuity IRA | $93,300 | Qualified IRA | ~2.15% ($2,000) | 8.73% | 10.85% | 5.18% | YES (if 73+) |
| JJ | Prudential APEX II HD7 (...03) | Non-Qualified Annuity | $223,800 | Non-Qualified | ~2.15% ($4,810) | 8.76% | 11.02% | 5.00% | NO |
| JJ | Prudential APEX II HD7 (...54) | Non-Qualified (Small) | $6,800 | Non-Qualified | ~2.15% ($150) | 8.44% | 10.89% | 5.01% | NO |
| TOTAL HOUSEHOLD | $787,900 | 70.7% IRA / 29.3% NQ | ~$11,900 / yr | Audited Baseline | |||||
Annuity Detail: Finite Insurance vs. Generational Legacy
Strategic Intent: Cut through the confusing sales jargon to understand the core tradeoff: (1) Finite Planning (paying heavy fees to insure against running out of cash in a single lifetime) vs. (2) Generational Legacy (owning real assets, minimizing fees, safely funding living expenses from bonds, and preserving the surplus for your family).
A Calculation Tool, Not Real Cash
The 7% "guaranteed growth" is a formula used ONLY to calculate a monthly paycheck. You CANNOT cash it out. If you leave or pass away, the 7% phantom balance disappears.
Insuring 1 Life vs. Family Legacy
Annuities are designed to "die with zero" by trading growth for a fixed check. Direct 60/40 index ownership safely funds retirement while passing 100% of accumulated wealth to kids.
Paying ~$10,000/yr for Unused Riders
Jack's contracts deduct ~3.35% in fees annually (~$10k/yr). If parents are not actively drawing guaranteed lifetime income, that fee is completely wasted money.
Upfront Comparison: Why Are There So Many Different Insurance Products?
A clear, side-by-side breakdown of the 3 distinct product types held across the 5 accounts.
Why did the advisor create so many fragmented accounts?
1. Tax Rules & Timing: Tax laws require IRAs (pre-tax) and Non-Qualified accounts (after-tax cash) to be kept legally separate. They were also purchased in different years (2010 vs 2017 vs 2025).
2. Insurance Sales Commissions: Annuities are sold as individual proprietary contracts. Rather than building 1 clean 3-fund index portfolio, brokers often sell multiple specialized insurance products (Variable Annuities for market growth + Fixed Index Annuities for downside protection), generating significant upfront and ongoing management fees.
| Feature / Question | 1. Prudential Variable Annuities (Jack) | 2. Allianz Fixed Index Annuity (Amie) | 3. Standard 60/40 Index Portfolio (Target) |
|---|---|---|---|
| Accounts & Balance |
3 Accounts: #2478 ($93k IRA), #8703 ($224k NQ), #8754 ($7k NQ) Total: $323,874 |
1 Account: #3734 (MasterDex X IRA) Total: $79,787 |
3 Consolidated Accounts: Mom IRA + Dad IRA + Joint Living Trust Total: $787,955 |
| Plain English Definition | Mutual funds inside an insurance wrapper with an expensive guaranteed paycheck rider ("Highest Daily"). | Insurance bond contract with a 0% floor (cannot lose money), but upside returns are capped at ~2%. | Direct ownership of low-cost Vanguard/iShares index funds (60% Stocks for growth / 40% Bonds for cash safety). |
| Where Money is Invested | Real stock/bond sub-accounts inside Prudential (balance fluctuates with the stock market). | Allianz's general corporate bond pool + index call options (money is NOT in the stock market). | Actual shares of US total market (VTI), International (VXUS), and Total Bond Market (BND). |
| Annual Fee Drag |
~3.35% – 3.50% / year (~$10,850/yr in insurance + rider + fund fees) |
Hidden Growth Spread (No fee line, but keeps all dividends and caps gains) |
0.04% / year (~$315/yr total portfolio fee) |
| Actual Track Record | Grew from ~$130k to $323k over 15.6 years, but lagged S&P 500 index by -$1.1M due to fee drag. | Averaged only 1.56% / yr over 9 years (0.00% in last 12 months). Barely matched cash in a checking account. | Historical 60/40 benchmark generated ~8.2% annualized return with smooth risk reduction. |
| Lockup / Surrender Penalty |
0% Surrender Fee (100% liquid; expired in 2017) |
~1% Penalty Remaining (Expires Sept 2027; $25k/yr free withdrawal right now) |
0% Lockup Always (100% liquid every day; withdraw or transfer anytime) |
| Generational Legacy (Kids) | Phantom "7% guarantee" evaporates at death. Only real cash value passes to kids (gains taxed as ordinary income). | Principal is safe, but severe purchasing power loss from inflation leaves much less real value to heirs. | 100% of accumulated market growth, dividends, and principal passes tax-efficiently to children or Living Trust. |
Visual Flowchart: Index Fund Brokerage vs. Variable Annuity Cash Flows
Tracing where deposits go, where fees leak out, and how money reaches the family.
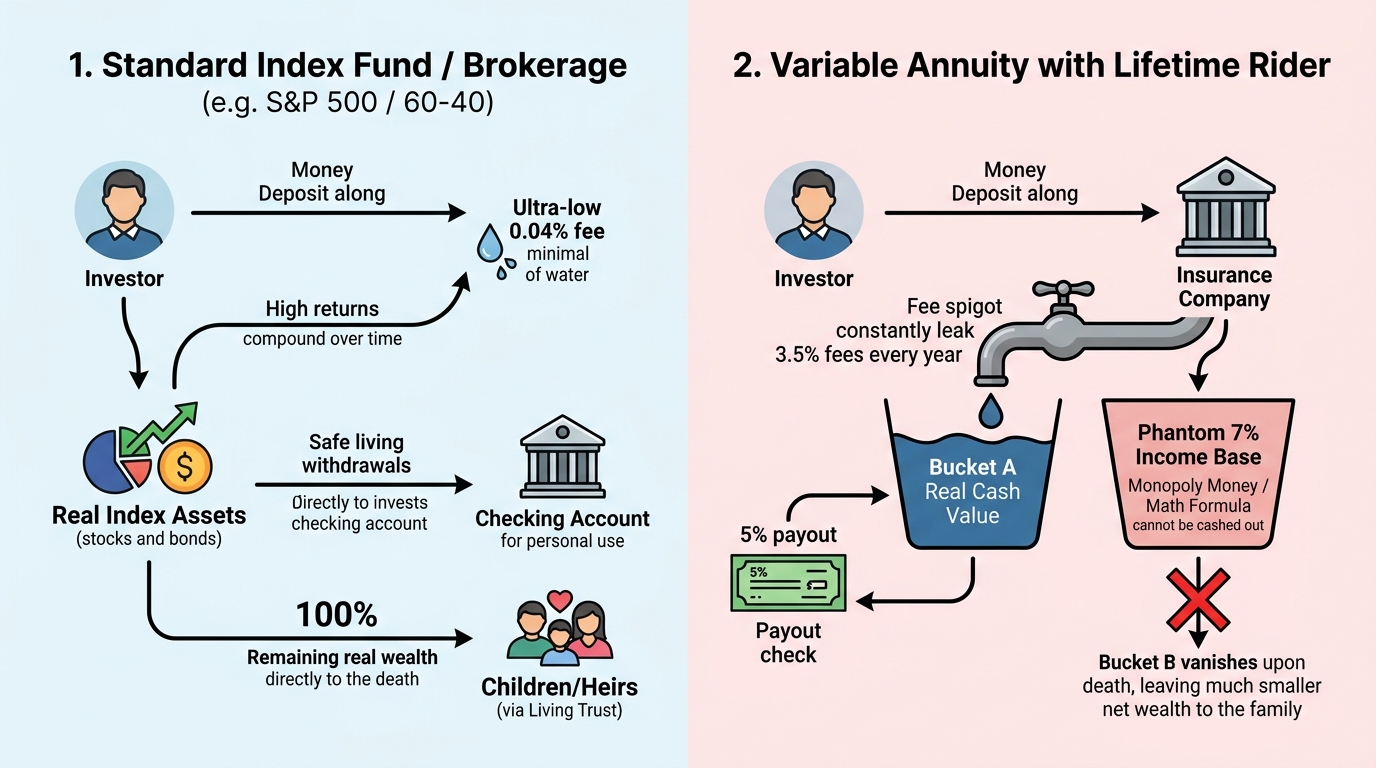
Model 1: Direct Index Brokerage (Simple & Transparent)
Money buys actual index funds (S&P 500 / 60-40). Only a microscopic 0.04% fee is paid. Safe living expenses ($30k/yr) flow directly to your checking account. 100% of remaining wealth stays in the family and passes smoothly to children via a Living Trust.
Model 2: Variable Annuity with Rider (Two Buckets & Leaking Spigot)
Money splits into Bucket A (Real Cash) and Bucket B (Phantom 7% Income Base). A heavy ~3.5% fee spigot drains Bucket A every year. Payout checks drain Bucket A first. When you pass away, Bucket B disappears, leaving far less inheritance for the family.
Annuity Jargon Decoder: What the Advisor Said vs. What It Actually Means
Translating complex insurance marketing terms into plain everyday English.
This is an artificial ledger number used ONLY to calculate a 5% annual payout if you annuitize. You cannot withdraw it as cash, you cannot transfer it to a bank, and it disappears when you pass away.
This is the actual dollar amount shown on the statement ($323k for Jack / $80k for Amie). This is the only money you actually own, what can be rolled over to Fidelity, and what you leave to heirs.
Jack pays ~$10,000 every year to Prudential for the "Highest Daily" income guarantee. If Jack isn't taking lifetime payout checks, he is paying $10k/yr for insurance he isn't using.
Allianz promises you can't lose money in a crash (0% floor), but in return, they cap your upside at ~2%–3% and pocket all dividends. This is why Amie's $80k made only 1.56% per year since 2017.
Finite Lifetime Planning ("Die with Zero")
"I am terrified of outliving my money at age 95. I don't care about leaving wealth to my children or family—I just want an insurance company to guarantee a fixed monthly check until the day I die."
Generational Legacy Planning ("Family Ownership")
"I want 100% control of my money. I want safe living expenses ($30k/yr) funded from low-risk bonds, while our stocks grow to beat inflation. Whatever is left over belongs to our children and grandchildren."
Real Family Numbers: What Is Happening to Jack & Amie Right Now
The factual reality of the 4 insurance contracts held in the portfolio.
Jack's Prudential Contracts ($323,900)
15.6 Yrs Old
• Real Cash Value: $323,900 across 3 contracts (100% liquid; surrender charges expired in 2017).
• Real 15-Year Growth: Only 4.7% to 5.2% annualized because Prudential took ~3.35% in fees off the top every year.
• The Reality: If Jack is not taking a lifetime paycheck from Prudential, he is surrendering ~$10,800 every year for an unused insurance promise.
Amie's Allianz MasterDex FIA ($79,800)
9.0 Yrs Old
• Real Cash Value: $79,800.
• Real 9-Year Growth: Only 1.56% annualized (and 0.00% last year).
• The Reality: A standard 60/40 balanced index grew to $138,000 over the same 9 years. The Allianz caps caused an ~$58,000 wealth loss while inflation eroded purchasing power.
Deep Dive: How the "7% Guarantee" & "Unused Riders" Actually Work
The mechanics of the Highest Daily (HD6/HD7) riders and why fees are leaking right now.
• Current Total: ~$323,900 (Jack) • $79,800 (Amie)
• What It Is: Your real money in the market. Subject to stock/bond performance.
• Control & Freedom: This is what you can roll over to Fidelity tax-free or leave to your children via a Living Trust.
• Current Total: Phantom calculation formula number (e.g., $450k+).
• What It Is: "Monopoly Money" used strictly to calculate a 5% annual lifetime payout check.
• The Catch: CANNOT be cashed out. CANNOT be inherited by kids. Vanishes completely upon death or contract transfer.
Current Status: The Rider is Active but NOT in Payout Mode (In "Deferral Phase")
The statement shows that Jack’s accounts are growing with positive 3-year market gains without systematic monthly lifetime payout checks. This confirms the contracts are in the Deferral Phase. Jack is paying approximately ~$3,800/year specifically for the HD6/HD7 rider warranty (and ~$10,850/year in total annuity drag) for an insurance claim he is not actively taking.
- "Is Jack currently taking any formal Lifetime Income distributions under the HD6/HD7 riders on accounts ...78, ...03, and ...54, or are they still in the deferral phase?"
- "What is the exact current dollar amount of the 'Income Base' vs. the 'Contract Cash Value' on each contract?"
- "What is the exact annual fee breakdown (Mortality & Expense + Rider Fee + Underlying Subaccount Fees) deducted across all 3 Prudential contracts?"
Stay with Financial Advisor (EH Shum / LPL)
Strategic Intent: Maintain 100% hands-off management, delegating rebalancing and RMD calculations to the financial advisor, at the cost of high ongoing fee drag (~$12,000–$14,000/yr) and underperforming insurance wrappers.
100% Delegated Service
Parents never have to log in to execute trades, rebalance sleeves, or calculate required minimum distribution (RMD) tables.
-$155k to -$185k over 10 Yrs
Advisor wrap fee (1.0%) + Prudential M&E insurance fees (1.3%) + fund fees create continuous compounding drag on growth.
Sub-Optimal Growth Vehicles
Allianz FIA yields ~1.56% lifetime; non-qualified variable annuities convert capital gains into ordinary income tax upon distribution.
Per-Account Breakdown
All 5 accounts remain under advisoryMWP IRA Rollover (American Funds ...61) • $384,300
Advisor manages through LPL wrap model. Fee: ~1.00% advisory + 0.40% fund exp.
Prudential APEX II HD6 (IRA ...78) • $93,300
Held in AST subaccounts with high M&E insurance fee (~1.30%) + subaccount fee (~0.85%).
Allianz Master Dex X (FIA ...34) • $79,800
Fixed Index Annuity earning ~0%–1.5% due to insurer participation caps.
Prudential APEX II HD7 (...03 & ...54) • $230,600
Non-qualified variable annuities holding AST subaccounts. Total fee ~2.15%.
Minimum Tax Strategy
- No Tax on Qualified IRAs: AA's $384k IRA and JJ's $93k IRA can move freely via direct trustee transfer.
- Do Not Cash Out NQ Annuities: Cashing out JJ's $230.6k non-qualified annuities to a bank triggers ordinary income tax on all gains.
- Section 1035 Exchange: Use direct 1035 transfer to low-cost annuity (0.25%) to preserve tax-deferred compounding.
Scenario 1 Financial Summary
Move "Easy" IRAs First ($477,600)
Strategic Intent: Move the straightforward individual IRAs (AA American Funds + JJ Prudential IRA) to a low-cost custodian immediately with $0 tax drag. Hold the complex Non-Qualified annuities and Allianz FIA until surrender schedules and riders are reviewed.
Moves $477,600 Tax-Free
Direct trustee-to-trustee IRA rollovers (AA American Funds $384.3k + JJ Prudential IRA $93.3k) trigger zero taxable income.
Saves ~$7,380 Every Year
Blended fee drag drops from 1.52% down to 0.87%, preserving ~$80k–$95k in compounding wealth over 10 years.
Zero Surrender Risk
Leaves the complex non-qualified variable annuities and Allianz contract untouched while verifying surrender dates and riders.
Step-by-Step Per-Account Migration
Phase 1 ExecutionAA: Move MWP IRA Rollover ($384,300)
Execution: Open an Individual Rollover IRA in AA's name at Fidelity/Schwab. Initiate an online ACATS Direct Transfer from LPL account `...61`. Funds transfer in-kind or as cash within the IRA wrapper.
JJ: Move Prudential APEX II IRA ($93,300)
Execution: Open an Individual Rollover IRA in JJ's name. Submit a Trustee-to-Trustee IRA Direct Transfer form to liquidate the annuity directly into JJ's new Rollover IRA at Fidelity/Schwab. Surrender fees are 0% (contract started 2010).
Remain on Status Quo ($310,400 Total)
Keep the Non-Qualified annuities ($230.6k for JJ) and Allianz FIA ($79.8k for AA) with current carriers while reviewing 1035 exchange options and surrender periods for Phase 2.
Target 60/40 Allocation ($477.5k)
60% Stocks (Growth) / 40% Bonds (Safety) using low-cost index ETFs (0.04% avg exp):
Scenario 2 Financial Summary
100% Self-Managed: Full Transition ($787,955)
Strategic Intent: Total elimination of all advisory wrap fees and high insurance M&E drag across all 5 accounts. Consolidate into streamlined individual accounts (no joint IRAs allowed by IRS) using strict tax-shielding transfers (1035 Exchanges + Direct Rollovers) for $0 in immediate taxes.
$0 Immediate Tax Bill
Direct individual IRA rollovers for $557k + IRS Section 1035 tax-free exchange for $231k non-qualified variable annuities.
Saves ~$11,150 / Year
Household fee drag drops from ~1.52% ($11,950) down to ~0.10% ($790), preserving $150,000+ over 10 years.
Fidelity is Optimal Choice
Fidelity offers direct 0.25% no-load variable annuity (FPRA) for 1035 exchanges, whereas Vanguard exited the direct annuity business.
Account Consolidation Blueprint: 5 Current Accounts ➔ 3 Clean Accounts
How the entire $787,955 household wealth simplifies under a single Fidelity login with $0 tax drag.
AA Individual Rollover IRA
Consolidates MWP IRA ($384.3k) + Allianz FIA ($79.8k). Invested in 60/40 Low-Cost Index Portfolio (VTI/VXUS/BND). $0 Tax Event.
JJ Individual Rollover IRA
Consolidates Prudential IRA ($93.3k). Direct trustee transfer into 60/40 Low-Cost Index Portfolio. $0 Tax Event.
JJ Fidelity Personal Retirement Annuity (FPRA)
Merges both NQ contracts ($223.8k + $6.8k) via IRS Section 1035 Exchange. 0.25% fee index subaccounts. $0 Immediate Tax.
Platform Comparison: Fidelity Investments vs. Vanguard Group
Evaluating which self-managed custodian best fits this specific household structure.
| Key Evaluation Factor |
Fidelity (Top Choice)
|
Vanguard Group |
|---|---|---|
| Non-Qualified Annuity 1035 Solution ($230.6k) | Industry Leader: Fidelity Personal Retirement Annuity (FPRA). No sales loads, 0.25% admin fee, index subaccounts at ~0.10%. Perfect 1-click 1035 destination. | Not Available Directly: Vanguard sold its variable annuity business to Transamerica. You cannot do a direct Vanguard-branded 1035 annuity exchange today. |
| IRA Rollovers ($557.3k Total) | Seamless ACATS direct transfer into individual IRAs (AA & JJ). Fractional ETF shares, zero maintenance fees, zero commissions. | Standard ACATS direct transfer. Vanguard ETF fractional shares available; classic index mutual funds. |
| Branch Support for Parents (JJ & AA) | 200+ Local Branches: Parents can walk in to sign paperwork, deposit checks, or get in-person medallion signature guarantee & notary services. | 100% Online / Phone Only: No physical retail branches for walk-in parent support. |
| Automated RMD Calculator & Distribution | Built-in automated RMD service. Calculates exact IRS required distribution and sets up automated monthly/annual bank transfers with tax withholding. | Automated RMD service available online for Vanguard IRA accounts. |
Exact 4-Step Execution Protocol (Minimum Tax Strategy & Transfer Rails)
Open AA Individual Rollover IRA at Fidelity. Initiate online ACATS transfer from LPL. Moves 100% electronically in 3–5 days with $0 tax. Liquidate American Funds inside the IRA and buy low-cost core 60/40 index ETFs (VTI/VXUS/BND).
Open JJ Individual Rollover IRA at Fidelity. Request direct trustee surrender from Prudential. Prudential liquidates to cash and wires/mails institutional check directly to Fidelity with $0 tax.
Contract started 9/2017. Withdraw the annual $25,000 penalty-free allowance directly into AA's Fidelity IRA now; in Sept 2027, transfer the remaining 100% balance with $0 surrender penalty.
DO NOT CASH OUT TO BANK. Open a Fidelity Personal Retirement Annuity (FPRA) (0.25% fee). Fidelity executes direct IRS Section 1035 Tax-Free Exchange from Prudential, eliminating ~$4,960/yr in fees while keeping 100% tax deferral.
10-Year Scenario Comparison & Fee Calculator
Strategic Intent: Dynamically project ending household balances and cumulative fee losses across all 3 scenarios based on market return, withdrawal rates, and time horizons.
-$168,000 in 10-Yr Fees
~1.52% fee drag compounded reduces the ending portfolio to ~$924,000 (at 6% gross return & $30k/yr withdrawals).
+$88,000 Wealth Boost
Moving just the easy IRAs ($477k) increases the 10-year ending balance to ~$1,012,000 while cutting fee drag by nearly half.
+$194,000 Wealth Boost
Full transition to Fidelity index portfolio + 1035 annuity increases 10-year ending balance to ~$1,118,000 (saving $156k in fees).
$924,000
Projected Ending Balance
$1,012,000
Projected Ending Balance
$1,118,000
Projected Ending Balance